
Figure 1
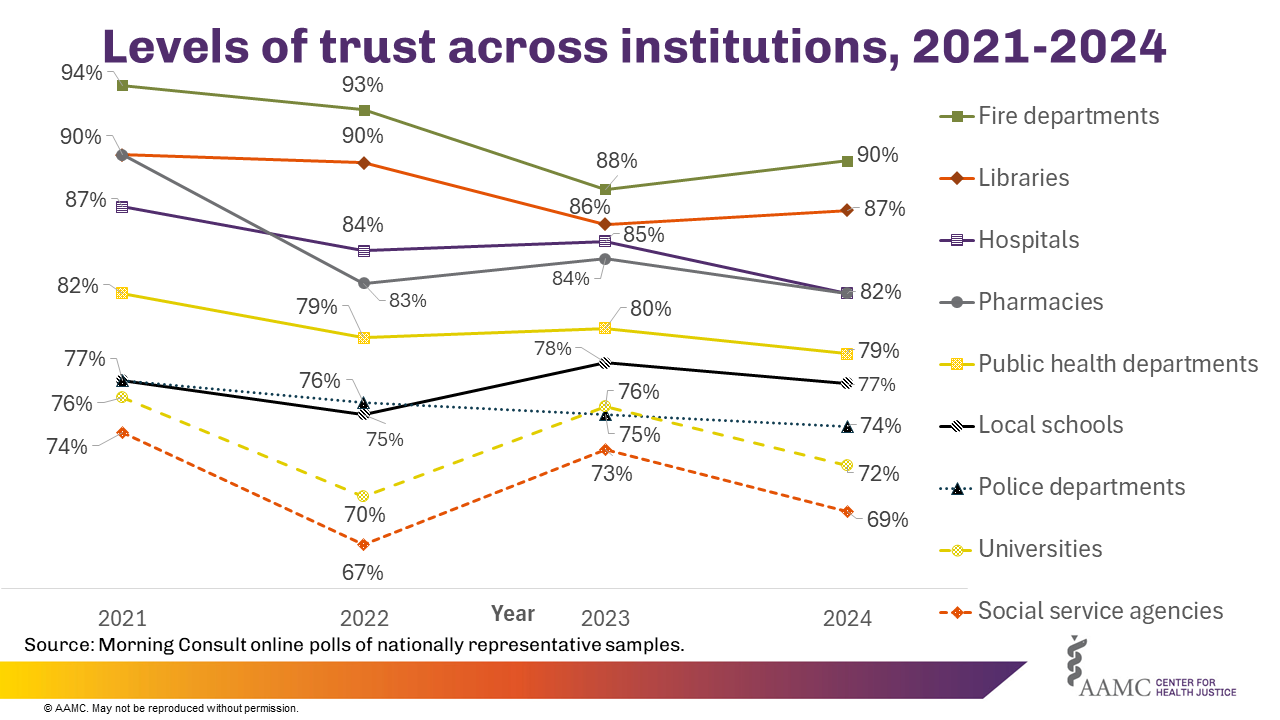
Figure 1
Presentation
Levels of trust across institutions, 2021-2024. The figure contains a line graph of the percentage of survey respondents who said they trusted institutions each year between 2021 and 2024. The y-axis lists nine institutions, and the x axis shows the levels of trust between each year (ranging from 94% to 67%).
Values
| Institution | 2021 | 2022 | 2023 | 2024 |
|---|---|---|---|---|
| Fire departments | 94% | 93% | 88% | 90% |
| Libraries | 90% | 90% | 86% | 87% |
| Hospitals | 87% | 84% | 85% | 82% |
| Pharmacies | 90% | 83% | 84% | 82% |
| Public health departments | 82% | 79% | 80% | 79% |
| Local schools | 77% | 75% | 78% | 77% |
| Police departments | 77% | 76% | 75% | 74% |
| Universities | 76% | 70% | 76% | 72% |
| Social service agencies | 74% | 67% | 73% | 69% |
Figure 2
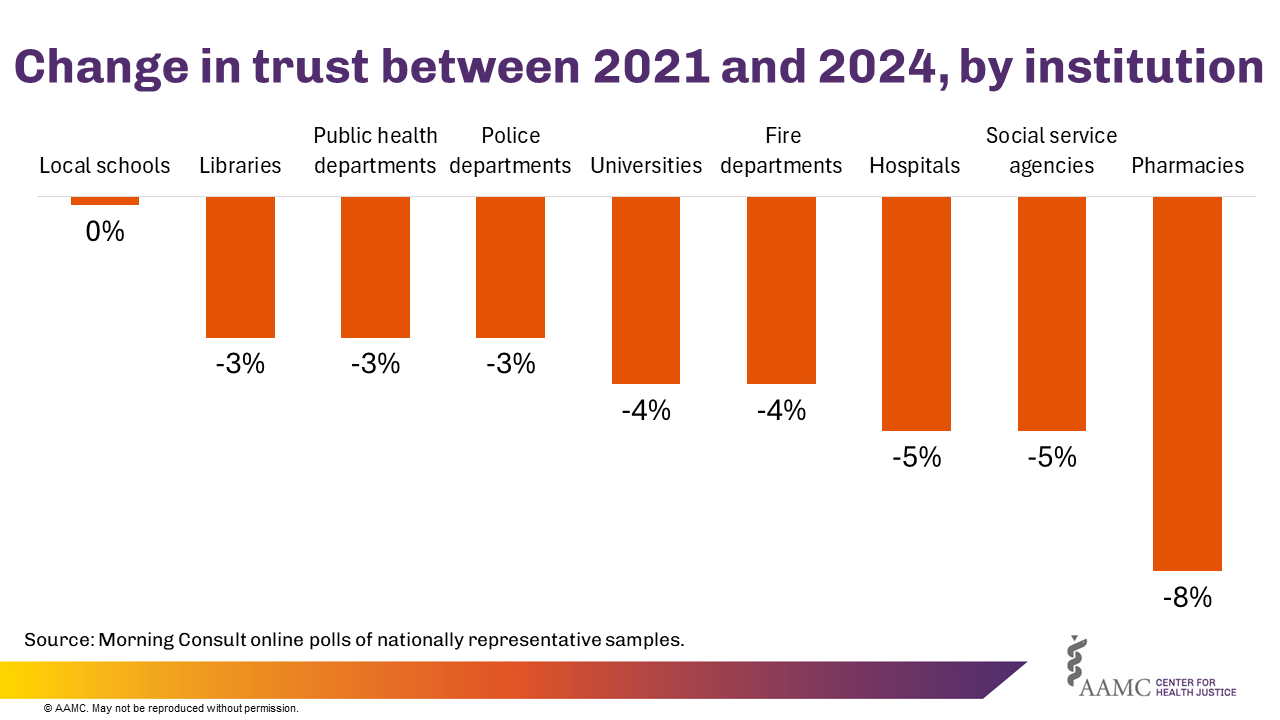
Figure 2
Presentation
Change in trust between 2021 and 2024, by institution. The figure contains a bar chart showing the decline in trust for sectors between 2021 and 2024. The x-axis names nine institutions, and the y-axis shows the degree to which the level of trust declined among survey respondents, ranging from 0% to -8%.
Values
| Sector | Change in trust between 2021 and 2024 |
|---|---|
| Local schools | 0% |
| Libraries | -3% |
| Public health departments | -3% |
| Police departments | -3% |
| Universities | -4% |
| Fire departments | -4% |
| Hospitals | -5% |
| Social services agencies | -5% |
| Pharmacies | -8% |