
Figure 1
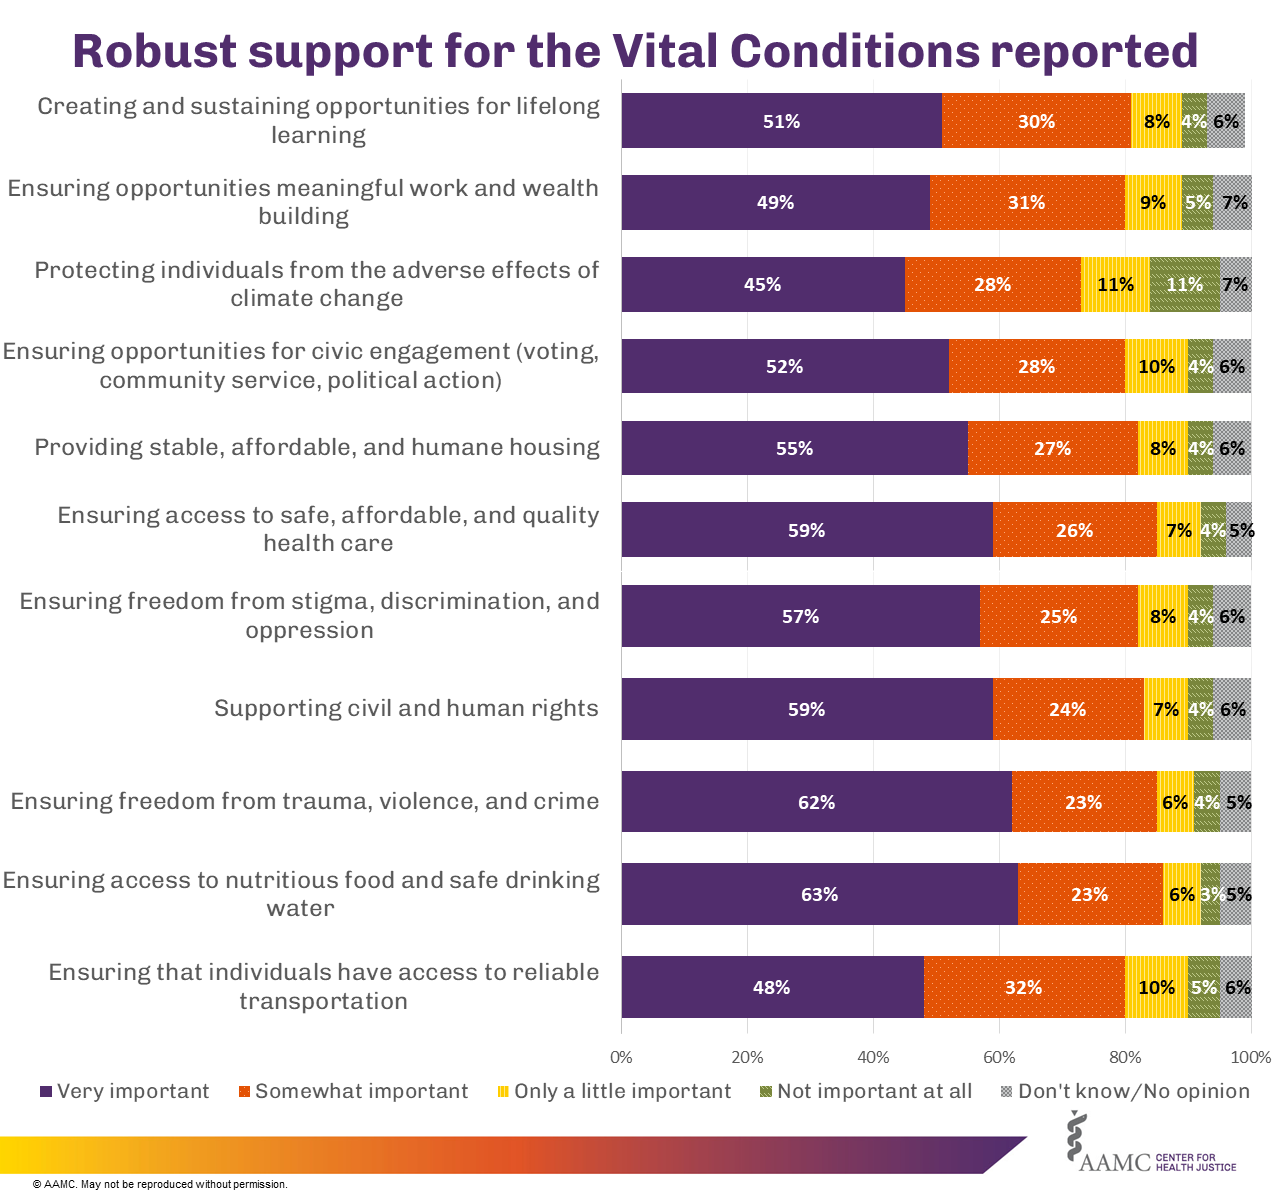
Figure 1
Presentation
The figure contains a bar graph showing the importance survey respondents assigned to 11 vital conditions ranging from "very important" to "not important at all." Robust support for all vital conditions was reported.
Values
| Vital Condition | Very important | Somewhat important | Only a little important | Not important at all | Don't know/No opinion |
|---|---|---|---|---|---|
| Ensuring access to safe, affordable, and quality health care | 59% | 26% | 7% | 4% | 5% |
| Providing stable, affordable, and humane housing | 55% | 27% | 8% | 4% | 6% |
| Ensuring opportunities for civic engagement (voting, community service, political action) | 52% | 28% | 10% | 4% | 6% |
| Protecting individuals from the adverse effects of climate change | 45% | 28% | 11% | 11% | 7% |
| Ensuring opportunities for meaningful work and wealth building | 49% | 31% | 9% | 5% | 7% |
| Creating and sustaining opportunities for lifelong learning | 51% | 30% | 8% | 4% | 6% |
| Ensuring that individuals have access to reliable transportation. | 48% | 32% | 10% | 5% | 6% |
| Ensuring access to nutritious food and safe drinking water. | 63% | 23% | 6% | 3% | 5% |
| Ensuring freedom from trauma, violence, and crime. | 62% | 23% | 6% | 4% | 5% |
| Supporting civil and human rights. | 59% | 24% | 7% | 4% | 6% |
| Ensuring freedom from stigma, discrimination, and oppression. | 57% | 25% | 8% | 4% | 6% |
Figure 2
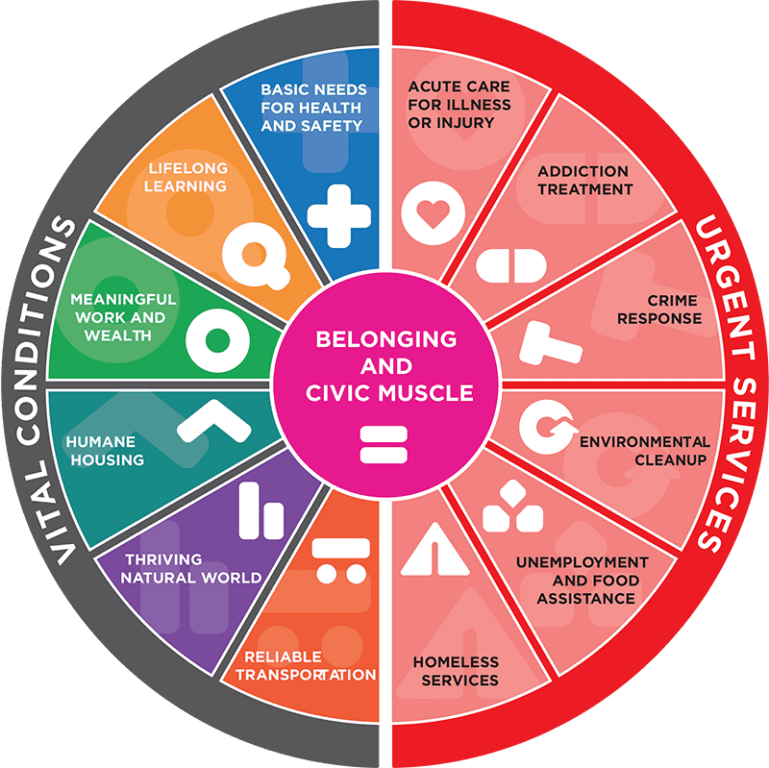
Figure 2
Image credit: The Rippel Foundation
Presentation
Infographic describing the vital conditions framework. A circle is divided in half. One half shows the vital conditions: basic needs for health and safety, lifelong learning, meaningful work and wealth, humane housing, thriving natural world, and reliable transportation. The second half shows urgent services: acute care for illness or injury, addiction treatment, crime response, environmental cleanup, unemployment and food assistance, and homeless services. In the center is belonging and civic muscle.